Google Ads Cost for Local Service Businesses: A 2026 Industry Breakdown

Introduction
A roofing company asked us what Google Ads would cost. They had already spoken with two other agencies. Both said "it depends." When pressed for specifics, one quoted $3,000 per month without explaining what that would buy. The other said "results vary by market."
Neither answer helps a business owner decide anything.
Google Ads costs for local service businesses do vary, but not randomly. The variation follows industry CPC benchmarks, market competition levels, and budget thresholds that are well-documented. This guide covers 2026 cost-per-click and cost-per-lead data across nine industries, the minimum budget that actually generates enough data to optimize, and the ROI math that shows whether paid search makes sense at your average job value.
How Google Ads Pricing Actually Works
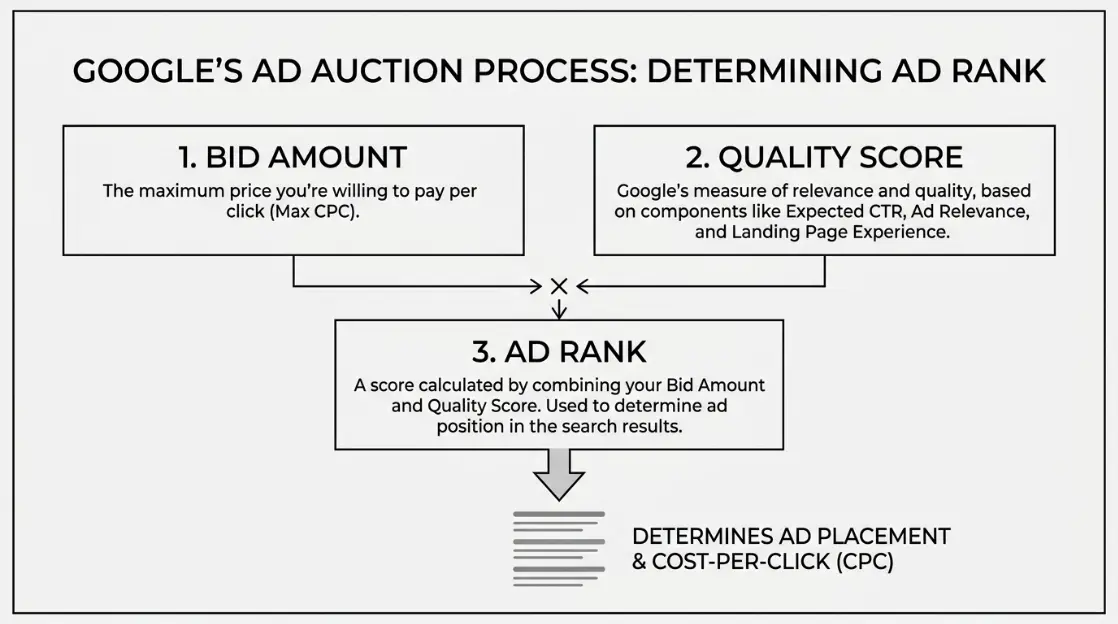
Google Ads runs on a pay-per-click model. You set a maximum bid per click, and Google runs an auction every time a relevant search happens. Your actual cost per click is not necessarily your maximum bid. It is determined by three factors: your bid, your Quality Score, and what competitors are bidding in that moment.
Quality Score is Google's rating of how relevant your ad, keywords, and landing page are to the search being run. A brake repair ad that sends traffic to a dedicated brake service page will consistently produce a higher Quality Score than one that sends traffic to a generic auto repair homepage. Higher Quality Score means you pay less per click than a competitor with the same bid but a weaker landing page. The difference is not small: a Quality Score of 8 versus 4 can lower your CPC by 30 to 50 percent.
The second major cost driver is competition density. A city with three plumbing companies bidding on "emergency plumber near me" will see far lower CPCs than a metro area with forty companies bidding on the same search. This is why the benchmarks below are ranges rather than single figures and why major metro budgets run 30 to 50 percent above the national averages.
Google Ads Cost Benchmarks by Industry: 2026
The table below reflects 2026 data across the US market, sourced from WordStream and LocaliQ industry benchmarks and aggregated campaign data from home service contractors. These are realistic ranges for well-managed campaigns, not theoretical minimums or inflated agency estimates.
| Industry | Avg CPC (Search) | Avg Cost Per Lead | Typical Monthly Budget |
|---|---|---|---|
| HVAC | $12 to $35 | $65 to $120 | $2,500 to $6,000 |
| Plumbing | $20 to $35 | $90 to $170 | $2,000 to $5,500 |
| Roofing | $28 to $45 | $150 to $300 | $3,000 to $8,000 |
| Auto Repair | $3 to $8 | $25 to $45 | $1,000 to $3,000 |
| Pest Control | $8 to $15 | $20 to $55 | $1,200 to $3,500 |
| Cleaning Services | $5 to $12 | $22 to $50 | $1,000 to $3,000 |
| Landscaping | $6 to $14 | $18 to $45 | $1,200 to $3,500 |
| Dental | $6 to $14 | $35 to $85 | $1,500 to $4,000 |
| Legal | $8 to $22 | $90 to $180 | $2,000 to $6,000 |
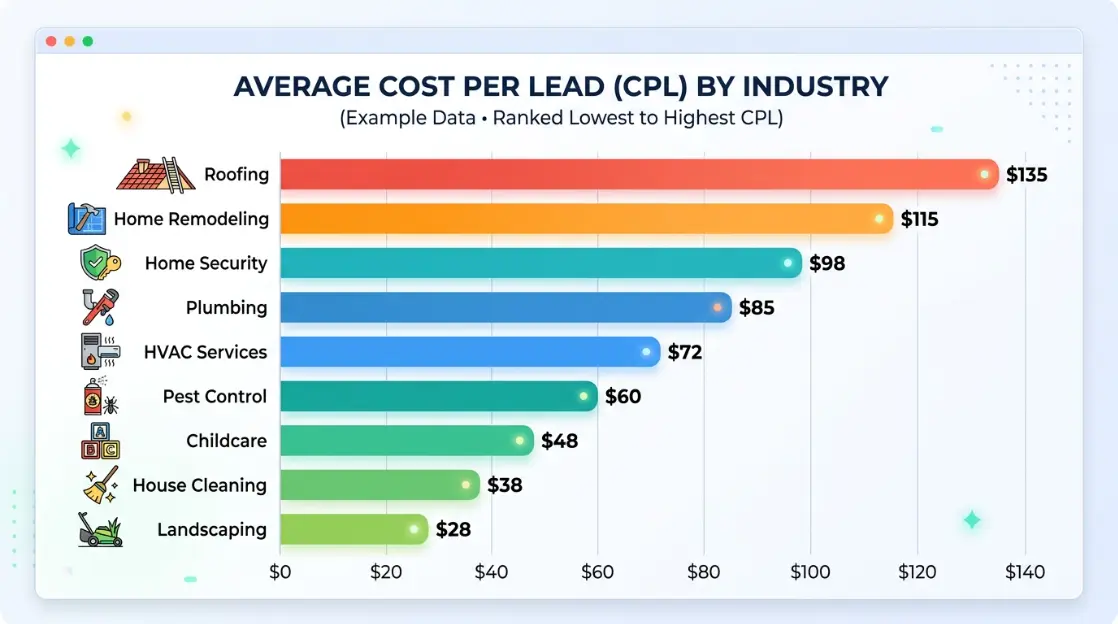
Why roofing costs three to five times more than auto repair: Roofing jobs average $10,000 to $20,000 in contract value, which means roofing companies can sustain a much higher bid per click and still profit from a single closed job. Auto repair shops average $150 to $400 per ticket, which caps how much a shop can profitably spend per click. Competition density tracks average job value across local service industries almost exactly.
For HVAC companies running Google Ads, the wide CPC range ($12 to $35) reflects the difference between a competitive summer market in Dallas bidding on "emergency AC repair" and a slower-season market bidding on "HVAC tune-up." The same business will pay different CPCs depending on when and where the ad runs.
How Much Budget Does a Local Service Business Actually Need?
The minimum viable Google Ads budget for a local service business is $1,000 per month. Below that threshold, you will not accumulate enough click data to optimize the campaign or enough conversion data to know what is and is not working.
A $500-per-month budget in a competitive plumbing market might buy 15 to 20 clicks. That is not enough data to draw conclusions about keyword performance, ad copy variations, or landing page conversion rates. The campaign will run for months without producing actionable insight.
The practical sweet spot for most local service businesses in the US is $2,000 to $4,000 per month. At that range, a well-structured campaign typically produces:
- 20 to 60 leads per month for lower-CPC industries (auto repair, pest control, cleaning services, landscaping)
- 10 to 30 leads per month for mid-range industries (HVAC, dental, legal)
- 8 to 20 leads per month for high-CPC industries (roofing, plumbing in competitive metros)
Businesses in major US metros like Dallas, Chicago, Los Angeles, or Phoenix should budget 30 to 50 percent more than the national benchmarks to maintain competitive ad positions. Plumbing companies in dense urban markets often find that the minimum competitive budget to hold top ad positions is $3,500 to $5,000 per month.
LSA vs. Search Ads: What Does Each Format Actually Cost?
Local Service Ads (LSAs) are a distinct Google product from traditional Search Ads. Instead of paying per click, you pay per verified lead, and Google only charges when a customer contacts your business directly through the ad listing.
Based on aggregated data covering $6.72 million in contractor ad spend across 888 US businesses in early 2026, the blended average cost per lead on Local Service Ads is $53. The equivalent cost per lead on traditional Search Ads for the same trades is approximately $104.
| Ad Format | Avg Cost Per Lead | Best Suited For |
|---|---|---|
| Local Service Ads (LSA) | $53 blended US average | HVAC, plumbing, electrical, roofing, pest control |
| Search Ads | $80 to $170 by industry | All industries; required where LSA is unavailable |
| Both formats combined | $60 to $90 blended | Businesses with $3,000 or more monthly budget |

LSAs are not available for every industry or region. They work most reliably for HVAC, plumbing, electrical, roofing, pest control, and a handful of other trades where Google has established enough verified demand data to run the format effectively. Legal and dental practices can access a similar format called Google Screened through a separate application and background check process.
For auto repair shops, cleaning services, and most landscaping companies, traditional Search Ads remain the primary paid search format in most US markets. Running both formats where available typically lowers blended cost per lead by 30 to 45 percent compared to Search Ads alone.
Why Your Actual Cost Will Differ From the Benchmarks
The table above is a starting reference. Your actual cost per lead will land above or below those ranges based on five factors that you directly control.
Landing page conversion rate. A page that converts 3 percent of clicks produces leads at three times the cost of one converting 9 percent. At a $10 CPC, a 3 percent rate costs $333 per lead. A 9 percent rate costs $111 for the same traffic. For roofing companies running Google Ads, a landing page that addresses the specific service searched (storm damage repair vs. new roof installation) consistently outperforms a generic homepage by a wide margin.
Negative keyword management. Auto repair, pest control, and cleaning services ads frequently attract clicks from job seekers, DIY product searchers, and researchers looking for tutorials. A negative keyword list blocking those searches typically reduces wasted spend by 25 to 40 percent in the first 30 days. Without one, a meaningful portion of your monthly budget goes to people who will never call.
Quality Score. A Quality Score of 8 to 10 means paying significantly less per click than a competitor with a score of 4 to 5 at the same bid. Quality Score is determined by keyword-to-ad relevance, ad-to-landing-page alignment, and your historical click-through rate. Improving it requires service-specific landing pages and tightly grouped keyword sets, not a single campaign covering every service the business offers.
Market competition and seasonality. HVAC advertising in July in Phoenix costs substantially more than in October. Roofing advertising in a market hit by a major hailstorm can spike 60 to 80 percent above normal CPCs for three to four weeks. CPCs are not static; they respond to market demand in real time.
Campaign structure. A single "auto repair" campaign with all service keywords in one ad group produces mediocre results for every service type. Separate campaigns for oil change, brake repair, and engine diagnostics, each with its own budget and landing page, consistently produce lower cost per lead and higher conversion rates. Pest control companies see the same pattern: a general pest control campaign produces worse results than separate campaigns for ants, rodents, mosquitoes, and termites.
Does the ROI Math Actually Work?
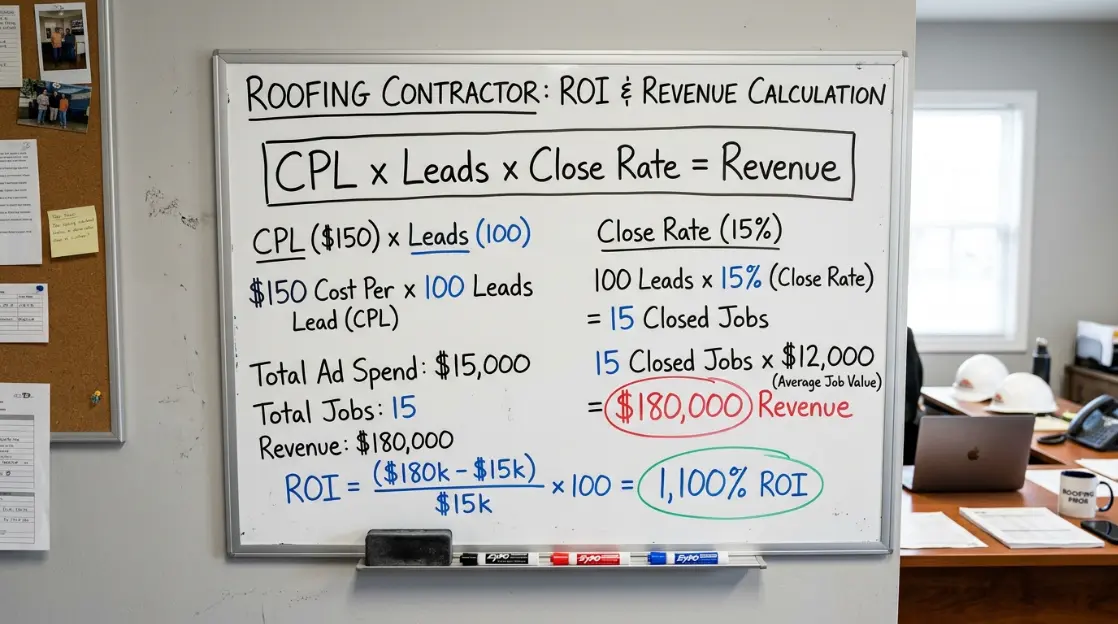
Cost per lead only answers half the question. The number that determines whether Google Ads makes sense for your business is the ratio of cost per lead to average job value.
| Industry | Avg Job Value | Break-Even CPL at 30% Close Rate | Typical CPL Range |
|---|---|---|---|
| Roofing | $12,000 | $3,600 | $150 to $300 |
| HVAC | $4,500 | $1,350 | $65 to $120 |
| Plumbing | $1,200 | $360 | $90 to $170 |
| Cleaning Services | $1,800 annual | $540 | $22 to $50 |
| Pest Control | $350 first year | $105 | $20 to $55 |
| Auto Repair | $280 per visit | $84 | $25 to $45 |
Two industries make the ROI case most clearly.
Roofing is straightforward. A company with a 30 percent close rate that pays $250 per lead earns $12,000 in revenue for every 3.3 leads. That is $3,840 for roughly $825 in lead cost. The math works at CPLs well above the $150 to $300 range. Even at $300 per lead with a 25 percent close rate, one closed job from a $3,000 monthly budget is break-even; two jobs is a four-to-one return.
Cleaning services makes the case differently. A residential cleaning client booking monthly service at $180 per visit for 18 months generates $3,240 in lifetime revenue. At a $35 CPL, acquiring that client costs about one percent of their total lifetime value. The short-term CPL looks modest; the actual economics are strong.
The industries where Google Ads ROI is harder to achieve are those with low average job values and high CPCs. A plumbing company where the majority of jobs are $150 drain cleanings in a market where CPL is $130 needs a high close rate and strong upsell to reach profitability. Understanding your average job value by service type, not just overall average, is the starting point for an honest assessment.
The Nextvure Approach to Google Ads for Local Service Businesses
Most agencies launch campaigns with broad match keywords and a homepage as the landing page. The first 60 to 90 days are spent burning budget to find out what does not work.
At Nextvure, we build campaigns from industry-specific CPC benchmarks, pre-built negative keyword lists, and service-specific landing pages before the first dollar is spent. For an HVAC company we worked with in a competitive Texas market, we launched three separate campaigns: emergency AC repair, AC installation, and furnace service. Each had its own landing page, its own negative keyword exclusions, and its own bid strategy based on the different average job values. Cost per lead stabilized at $78 in the first 30 days, down to $62 by month three as Quality Score data accumulated.
If your current campaigns are producing leads above the benchmarks in the table above, the cause is usually one of three things: landing page quality, negative keyword gaps, or a campaign structure that bundles too many service types together. Our pay-per-click management team identifies which one in the first campaign audit.
Conclusion
Google Ads costs for local service businesses range from $18 per lead for landscaping to $300 per lead for roofing. Neither number tells you whether the investment is worth making. The ratio of cost per lead to average job value, combined with your close rate, is the actual calculation that matters.
For most of the nine industries covered in this guide, a well-structured campaign with a $2,000 to $4,000 monthly budget produces leads at a cost that generates a positive return when close rates are reasonable. The exceptions are businesses in highly competitive metros or those with low average job values that leave little room for paid search profitability.
If you want a realistic forecast for your specific trade and market, Nextvure offers a free audit that includes your market's current CPC benchmarks, a lead volume estimate for your budget, and an analysis of where your current campaigns are above benchmark and why. Request your free Google Ads audit.